Metes and Bounds and Township and Range – American Land Records Part II
 11
11Nov
Land records are an incredibly important resource when doing genealogy research in the United States. These records do more than simply record where an ancestor lived or what property they owned; they can be a wealth of information about relationships, economic status, and much more!
In Part I of this two-part series, we discussed the importance of Land Platting – drawing out property boundaries as given in land records. Land platting, however, is only half of the equation! Here in Part II we’ll talk about Land graphing, which is similar to platting but used in different situations.
What is Land Graphing?
Land Graphing, just as land platting, involves drawing out the land description found in a land record, usually a land grant (the first sale of the land from the government to an individual) or a land deed (subsequent sales of the land between individuals). Graphing refers to land described using the Rectangular Survey system.
On May 20, 1785, the United States passed the Land Ordinance of 1785, which set precedent for how the government’s acquired land would be divided up and sold. This was called the Public Land Survey System. It involved dividing up the land into square townships that measured 6 miles along each side. These townships would be further divided into 1-square-mile sections, for a total of 36 sections per township. This land was then sold in portions of the sections, often divided in halves, quarters, etc.
On an interesting note- Section 16 of each township was set apart specifically for public education. Many schools were built in Section 16 of their township, or the proceeds from sales in that section were designated specifically to fund public education.
Review: State Land States vs. Federal Land States
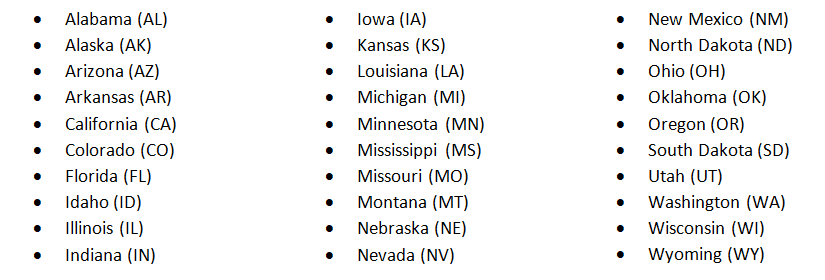
As a reminder – Rectangular Survey was used primarily in the Federal Land States. As mentioned in Part I, the State Land States generally used Metes and Bounds, which requires land platting. The following are Federal Land States, and thus you should expect to graph land from these states:
Rectangular Survey Terminology
As with Metes and Bounds land platting, it is helpful to know some of the terms or phrases that you should expect to see in a Rectangular Survey land deed. Knowing these terms can help you understand whether or not your deed was described in Rectangular Survey, as well as help you get a sense of how much property was bought before you even draw out the description.
If you see phrases including halves, quarters, sections, townships, and ranges, it is safe to say that you are dealing with a deed described in Rectangular Survey. Don’t forget, though, that the term township was also used to indicate a small geographic area within a county. Geographic townships were named (e.g. Washington Township) while survey townships were numbered (e.g. Township 3 North).
Listed below are some definitions of common words you may see used in a deed described through Rectangular Survey. These definitions were taken from the FamilySearch Wiki, specifically the United States Land Terms and Definitions page. The FamilySearch Wiki in general is an excellent reference tool, and they have good information regarding United States land records.
- Acre: 43,560 square feet or 4840 square yards; 640 acres = 1 square mile
- Base line: An imaginary line running east and west; a baseline intersects with a meridian
- Meridian: An imaginary line running north and south; a meridian intersects with a base line
- Patent: The legal document showing the initial transfer of land from the government
- Range: Township numbers running east and west from the meridians
- Section: A measurement of land which consists of one square mile or six hundred and forty acres
- Township: 1) A measurement of land six miles by six miles; 2) Township numbers running north and south from the baseline; 3) a governmental unit responsible for an area of approximately thirty-six square miles
- Tract: 1) A parcel of land; 2) a portion of a meridian section about twenty-four miles square, containing sixteen townships
Understanding Rectangular Survey:
Before diving into a real-life example of land graphing, let’s get a visual overview of how the Public Land Survey System, or Rectangular Survey works.
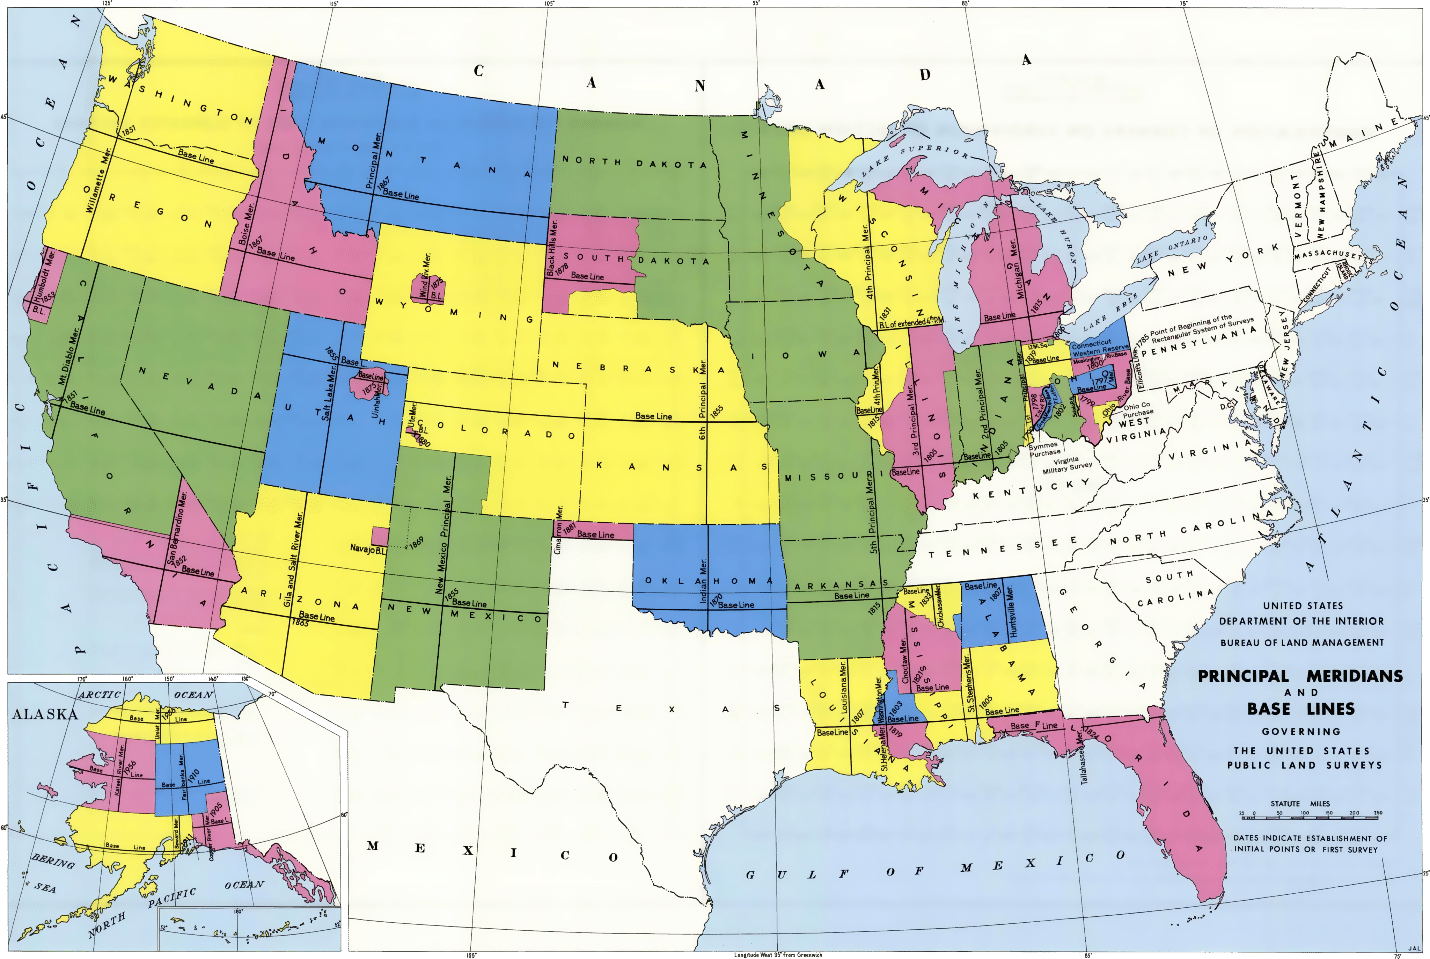
The system is based off of a network of base lines and principal meridians that crisscross the United States. Some states have multiple base lines or meridians, and some states share the same set. The base lines and meridians form the center point of the grid that the land divisions are based off of. When you are graphing land purchases, it is important to know which base line and meridian the survey is based off of. Sometimes it is stated outright in the record, other times you may have to look it up for yourself.
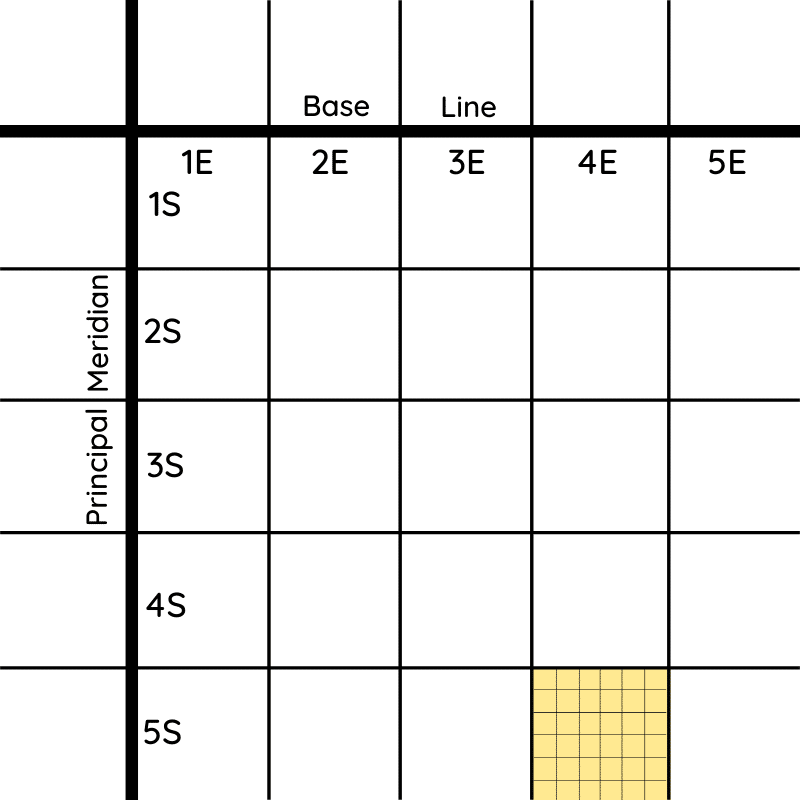
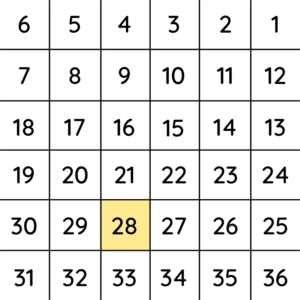
Each intersection of a base line and principal meridian marks the center point for the grid of townships and ranges based off of those lines. Townships are measured north and south along the vertical axis, while ranges are numbered east and west along the horizontal axis. The first graphic below shows the crossing of a base line and meridian, and shows how the townships and ranges are numbered. Each of these townships is 36 square miles (6 miles by 6 miles), and is further divided up into 36 sections. The second graphic shows how the numbering pattern used to number the 36 sections. Begin in the northeast corner of the township, and count moving to the west and down in a serpentine pattern. Section 36 should end in the southeast corner of the township. 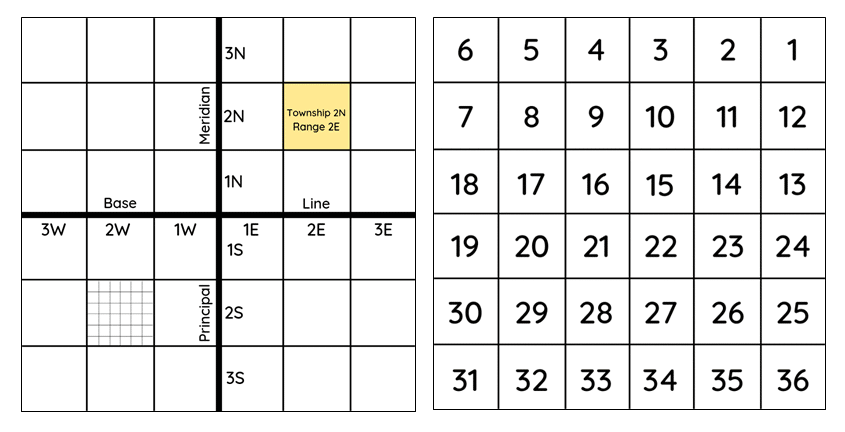
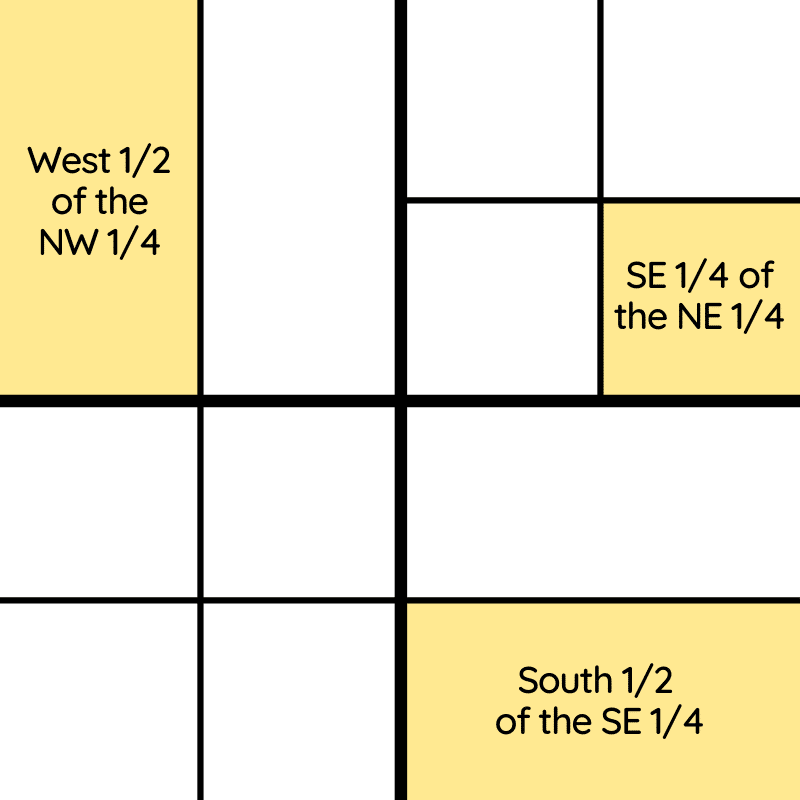
After the township was divided up into 36 1-square-mile sections, each section was further divided up into saleable portions. Generally, the township was divided up into quarters, with each corner being referred to as the Northeast Quarter, Southeast Quarter, Northwest Quarter, or Southwest Quarter. From there, each quarter was either sold as a whole, divided in half, or in quarters again. These quarter and half descriptions are what you will find written out in your ancestors’ land deeds. The image below shows three examples of the large variety of possible section divisions, and should help you see exactly what you will be working with when you find a deed to graph.
Example Deed:
Now that we have a working understanding of how the Rectangular Survey system works, let’s graph out a real deed for practice! Below is a deed found on FamilySearch from Washington County, Kansas.
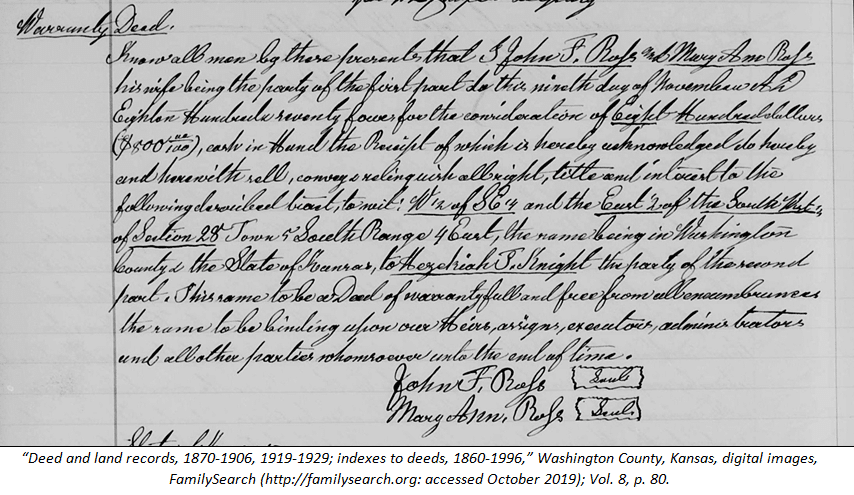
First, transcribe the description of the land so that it’s easier to read through and work with. This deed represents the sale of the following portion of land:
W ½ of SE ¼, and the East ½ of the South West ¼ of Section 28, Town 5 South Range 4 East.
The key to land graphing is to work from the largest division down to the smallest… working backwards in essence. Here, we see that the largest division is Township 5 South, Range 4 East. From the map above, we see that the northern border of Kansas is the baseline for the state, with the prime meridian running through the eastern half of the state. Counting from this baseline and meridian, we see that the township referenced in this deed is in this location (highlighted):
Now that we’ve found the township, return to the description and find the next largest division, which is the section. In the case of this deed, the tract we are graphing is in Section 28, shown highlighted below:
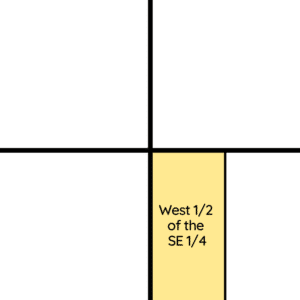
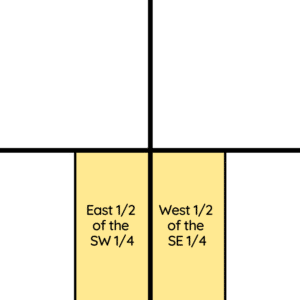
After locating the section the land deed describes, it’s time to graph out the actual portions of that section which were sold in the deed. In this record, two different portions of Section 28 were sold: The West ½ of the Southeast ¼, and the East ½ of the Southwest ¼. As with the work we’ve done so far, we’ll start graphing these portions backwards, by locating the larger divisions first.
Let’s start with the first part of the description: The West ½ of the Southeast ¼. We first locate the Southeast ¼ (or quarter) of Section 28, which is the lower right-hand quadrant. Since the description specifies that the West ½ (half) of the quadrant was purchased, we simply divide the quadrant vertically in two and label the western (left) half as part of the land purchase.
Next, do the same thing for the second portion of the description: East ½ of the Southwest ¼. This time, we’ll start with the Southwest quarter, or the lower left-hand quadrant. We’ll again divide the quadrant vertically, but instead of the left half, we’ll include the East or right half in our land purchase.
After finishing the graphing of the last portion of the description, we can now work back from the land description, to the section, to the township and place exactly where the land was that was purchased in Washington County, Kansas. It’s evident after graphing this deed that even though there were two land descriptions in the deed, it was really just one large piece of land! There needed to be two descriptions, however, because of the way that Rectangular Survey works. Sometimes you’ll see similar things happen across section numbers, or even across township lines. In time, you will start to be able to visualize the land descriptions more easily without having to walk through every step piece by piece like we’ve done here—but that will require some practice. Happy Graphing!
Amy